


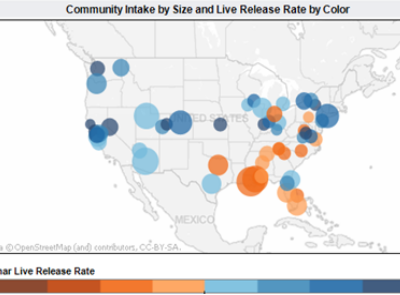
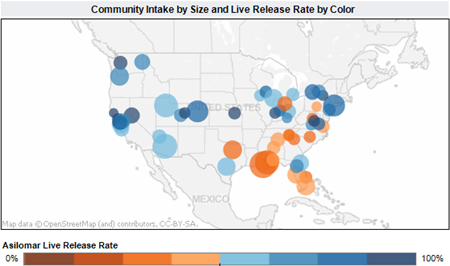
Here at Earthware, we have recently been working on a number of projects showing quite complex and multi-faceted data sets using consumer APIs such as Google Maps and Bing Maps. This has led us to explore lots of different ways of displaying more than one thing at a time on a map: We have looked at pie charts, shading, doughnuts (or donuts to our trans-Atlantic cousins). But, I keep returning to the view that;
- Maps are never going to replace Excel – when you get more than two numerical parameters that you want to look at at the same time then it is almost certainly better to use a table or at least a different type of graphic.


3. Just because you’ve got the data in a database, it doesn’t mean you automatically put it on the map – so often we see websites and maps that are designed around the needs of the owner “I want to get as much of my stuff out there as I can!” and not the needs of the user “I want to see only the thing or things that most interest me in the quickest and easiest way that I will understand”.
Anyway, I recently read an article by Matthew Erikson who I think really made my points for me in a very detailed way and so I thought I would point you in the direction of his article.
Neil


